
Hope for Health Equity (Part II): Virta Patient Outcomes by Socioeconomic Status


Key Takeaways
- Virta Health enrolls patients across the socioeconomic spectrum, including 27% who live in the two most disadvantaged Area Deprivation Index groups in the country.
- Patients improved blood sugar control across every ADI group, with at least a one-point average HbA1c reduction and some groups reaching levels below 6.5%.
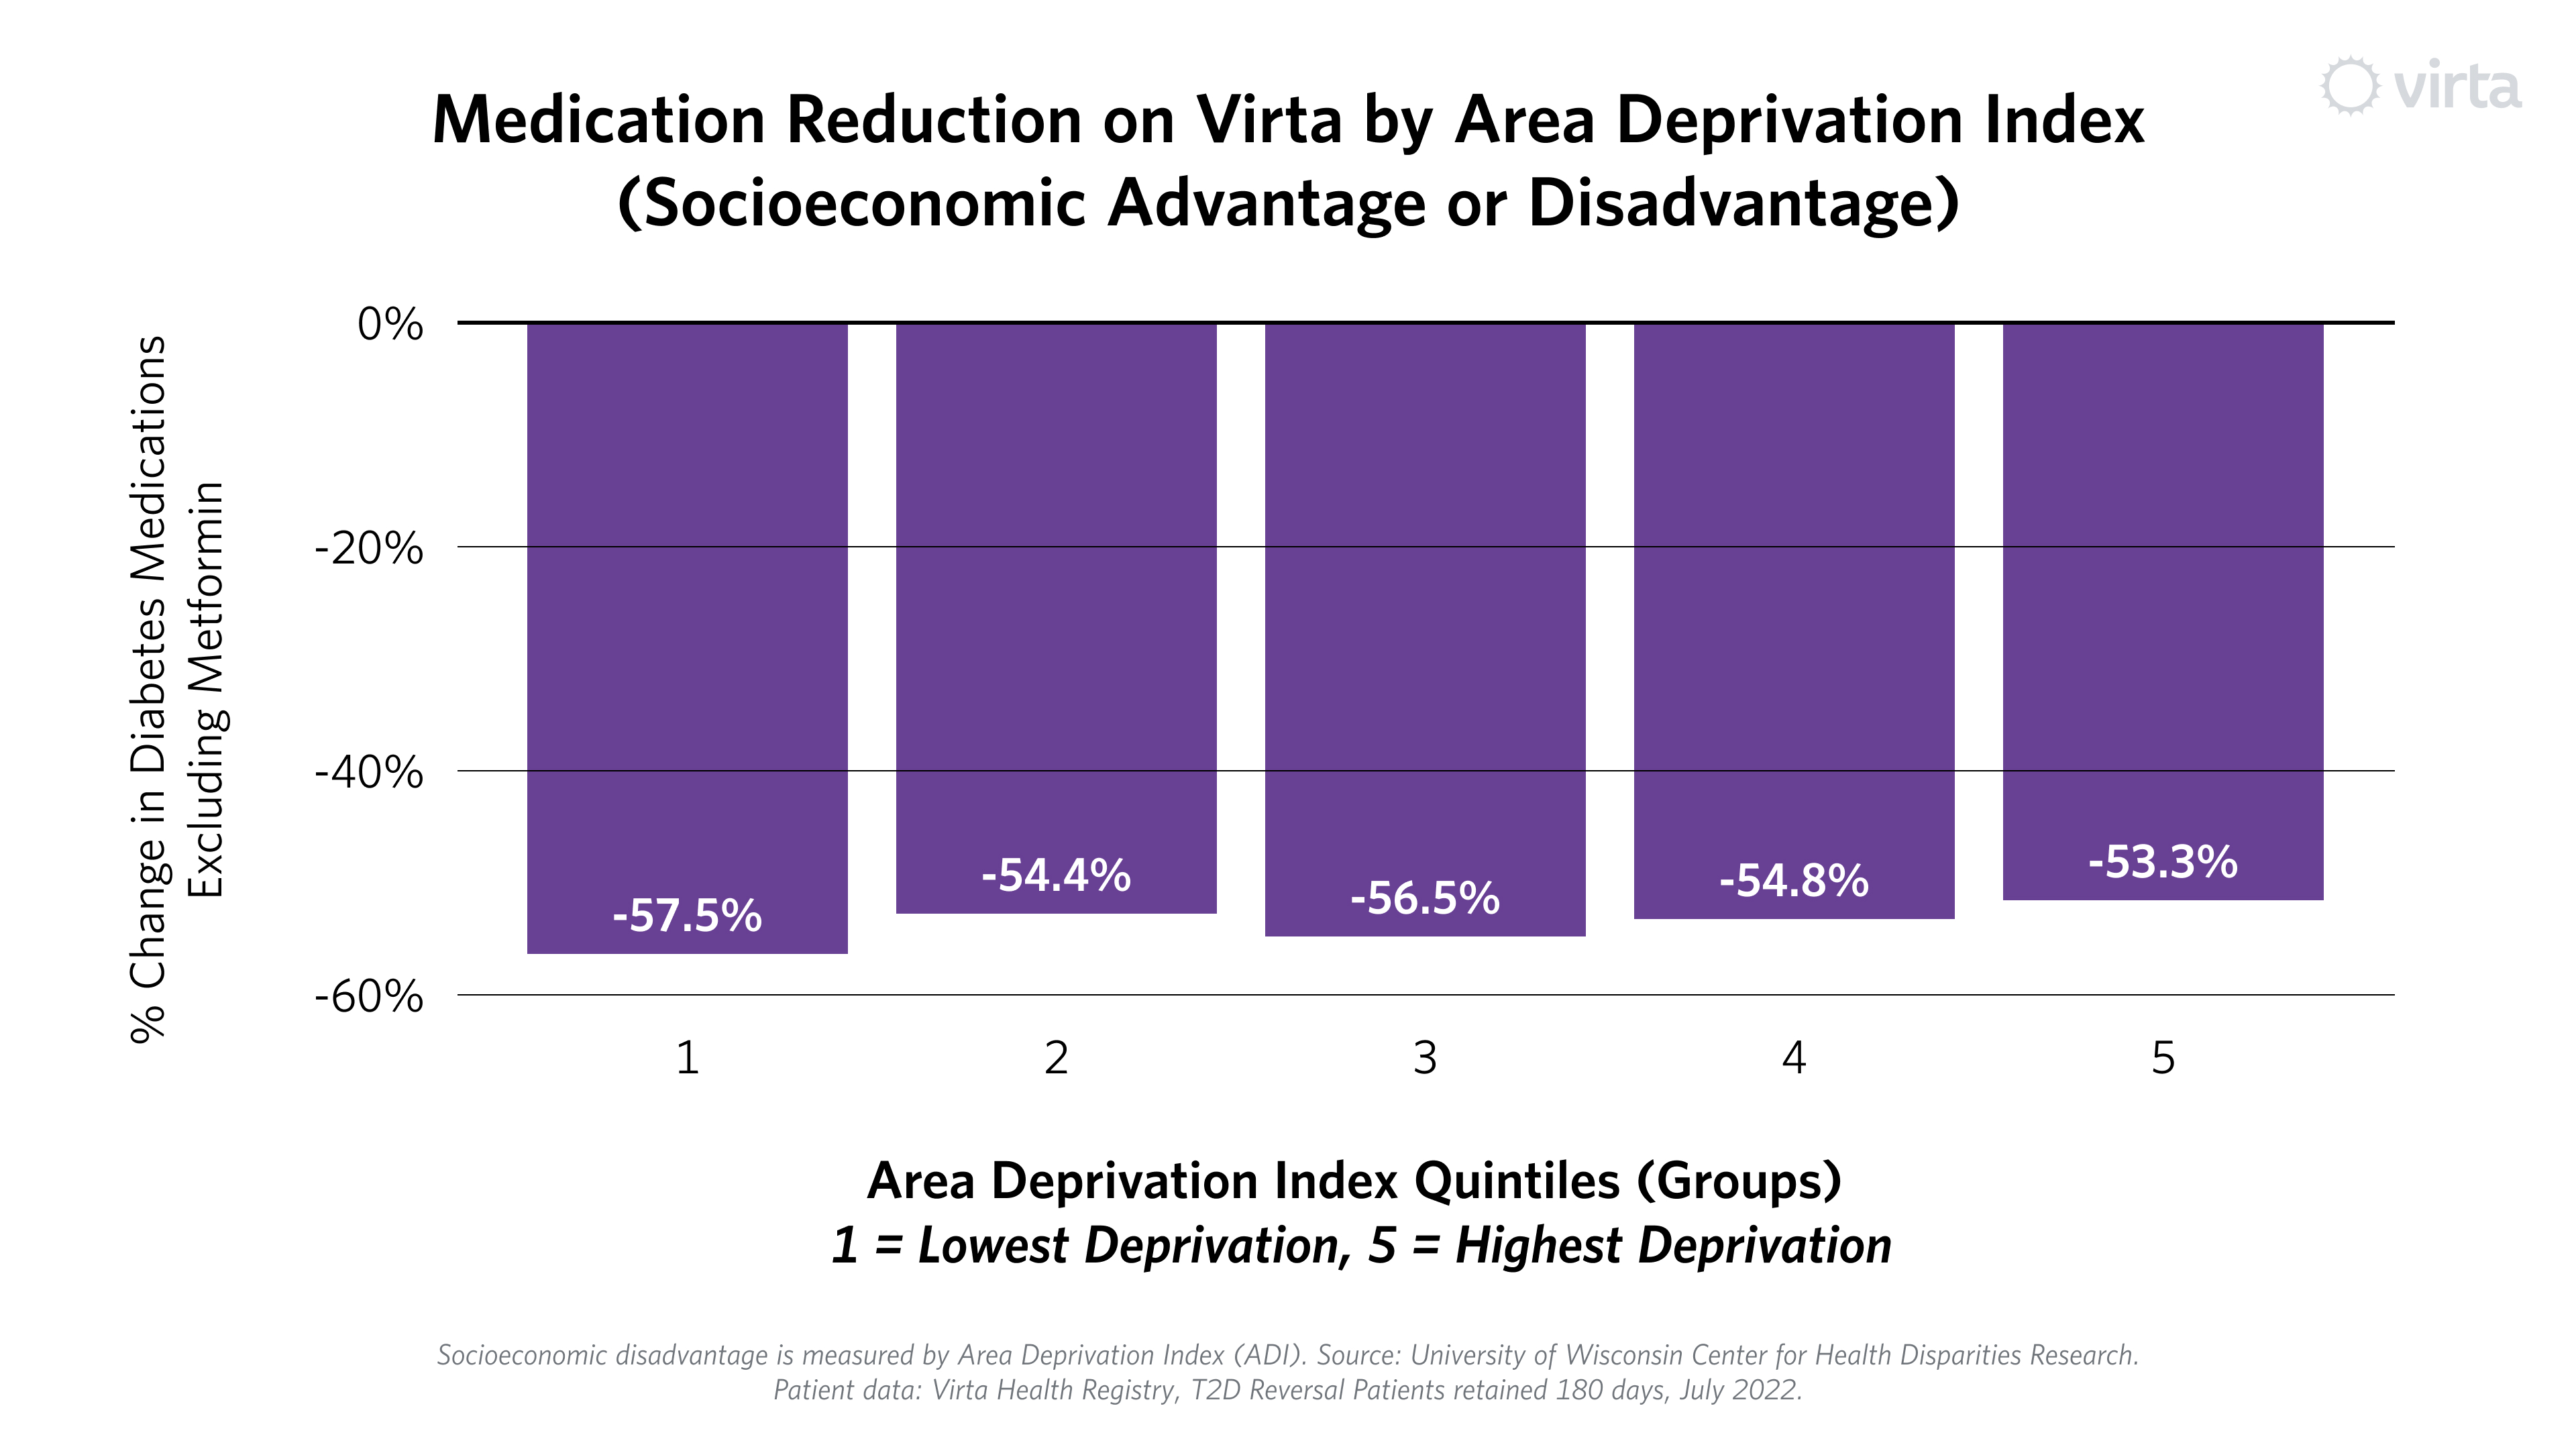
- Every ADI group also cut diabetes prescriptions by at least 50% excluding metformin, while reducing or eliminating the need for additional medications.
- Virta Health offers a fully virtual, individualized diabetes treatment model designed to deliver strong outcomes for people in both advantaged and disadvantaged communities.
This is Part II of a three part series on health equity. Part I summarized the disparities that exist in type 2 diabetes care. The series concludes with Part III: Outcomes by Race and Ethnicity.
In Part I of our series on health equity, we summarized the disparities that exist for people living with type 2 diabetes. In Part II, we begin to explore Virta patient outcomes, specifically through the lens of socioeconomic advantage or disadvantage.
In our exploration, we first asked a simple question: are we moving the needle for those hardest hit by type 2 diabetes?
To answer this question, we first looked at our outcomes based on where our population lives. Where someone lives is a strong indicator of a person’s risk of having diabetes and experiencing complications. Social determinants of health (SDOH)—income, housing, education, occupation, access to care, social structure and supports, and more—play a critical role in diabetes care and outcomes, and can vary substantially even for geographies that are in close proximity.
To help compare outcomes across geographies, we turned to the Area Deprivation Index (ADI). ADI is increasingly used as a strong proxy for socioeconomic conditions within a specific geographic area. Using census block groups or zip code, U.S. geographic areas are ranked by level of deprivation, then split into quintiles (five equal-sized groups). Group “1” includes the nation’s least disadvantaged areas, and group “5” includes the most disadvantaged areas.
Where do Virta patients live?
The first thing we noticed when we used ADI to look at our population living with type 2 diabetes is that we enroll people who live in all types of neighborhoods—from the most socioeconomically advantaged to the most disadvantaged. In fact, 27% of our patients come from the two most disadvantaged groups in the country.¹
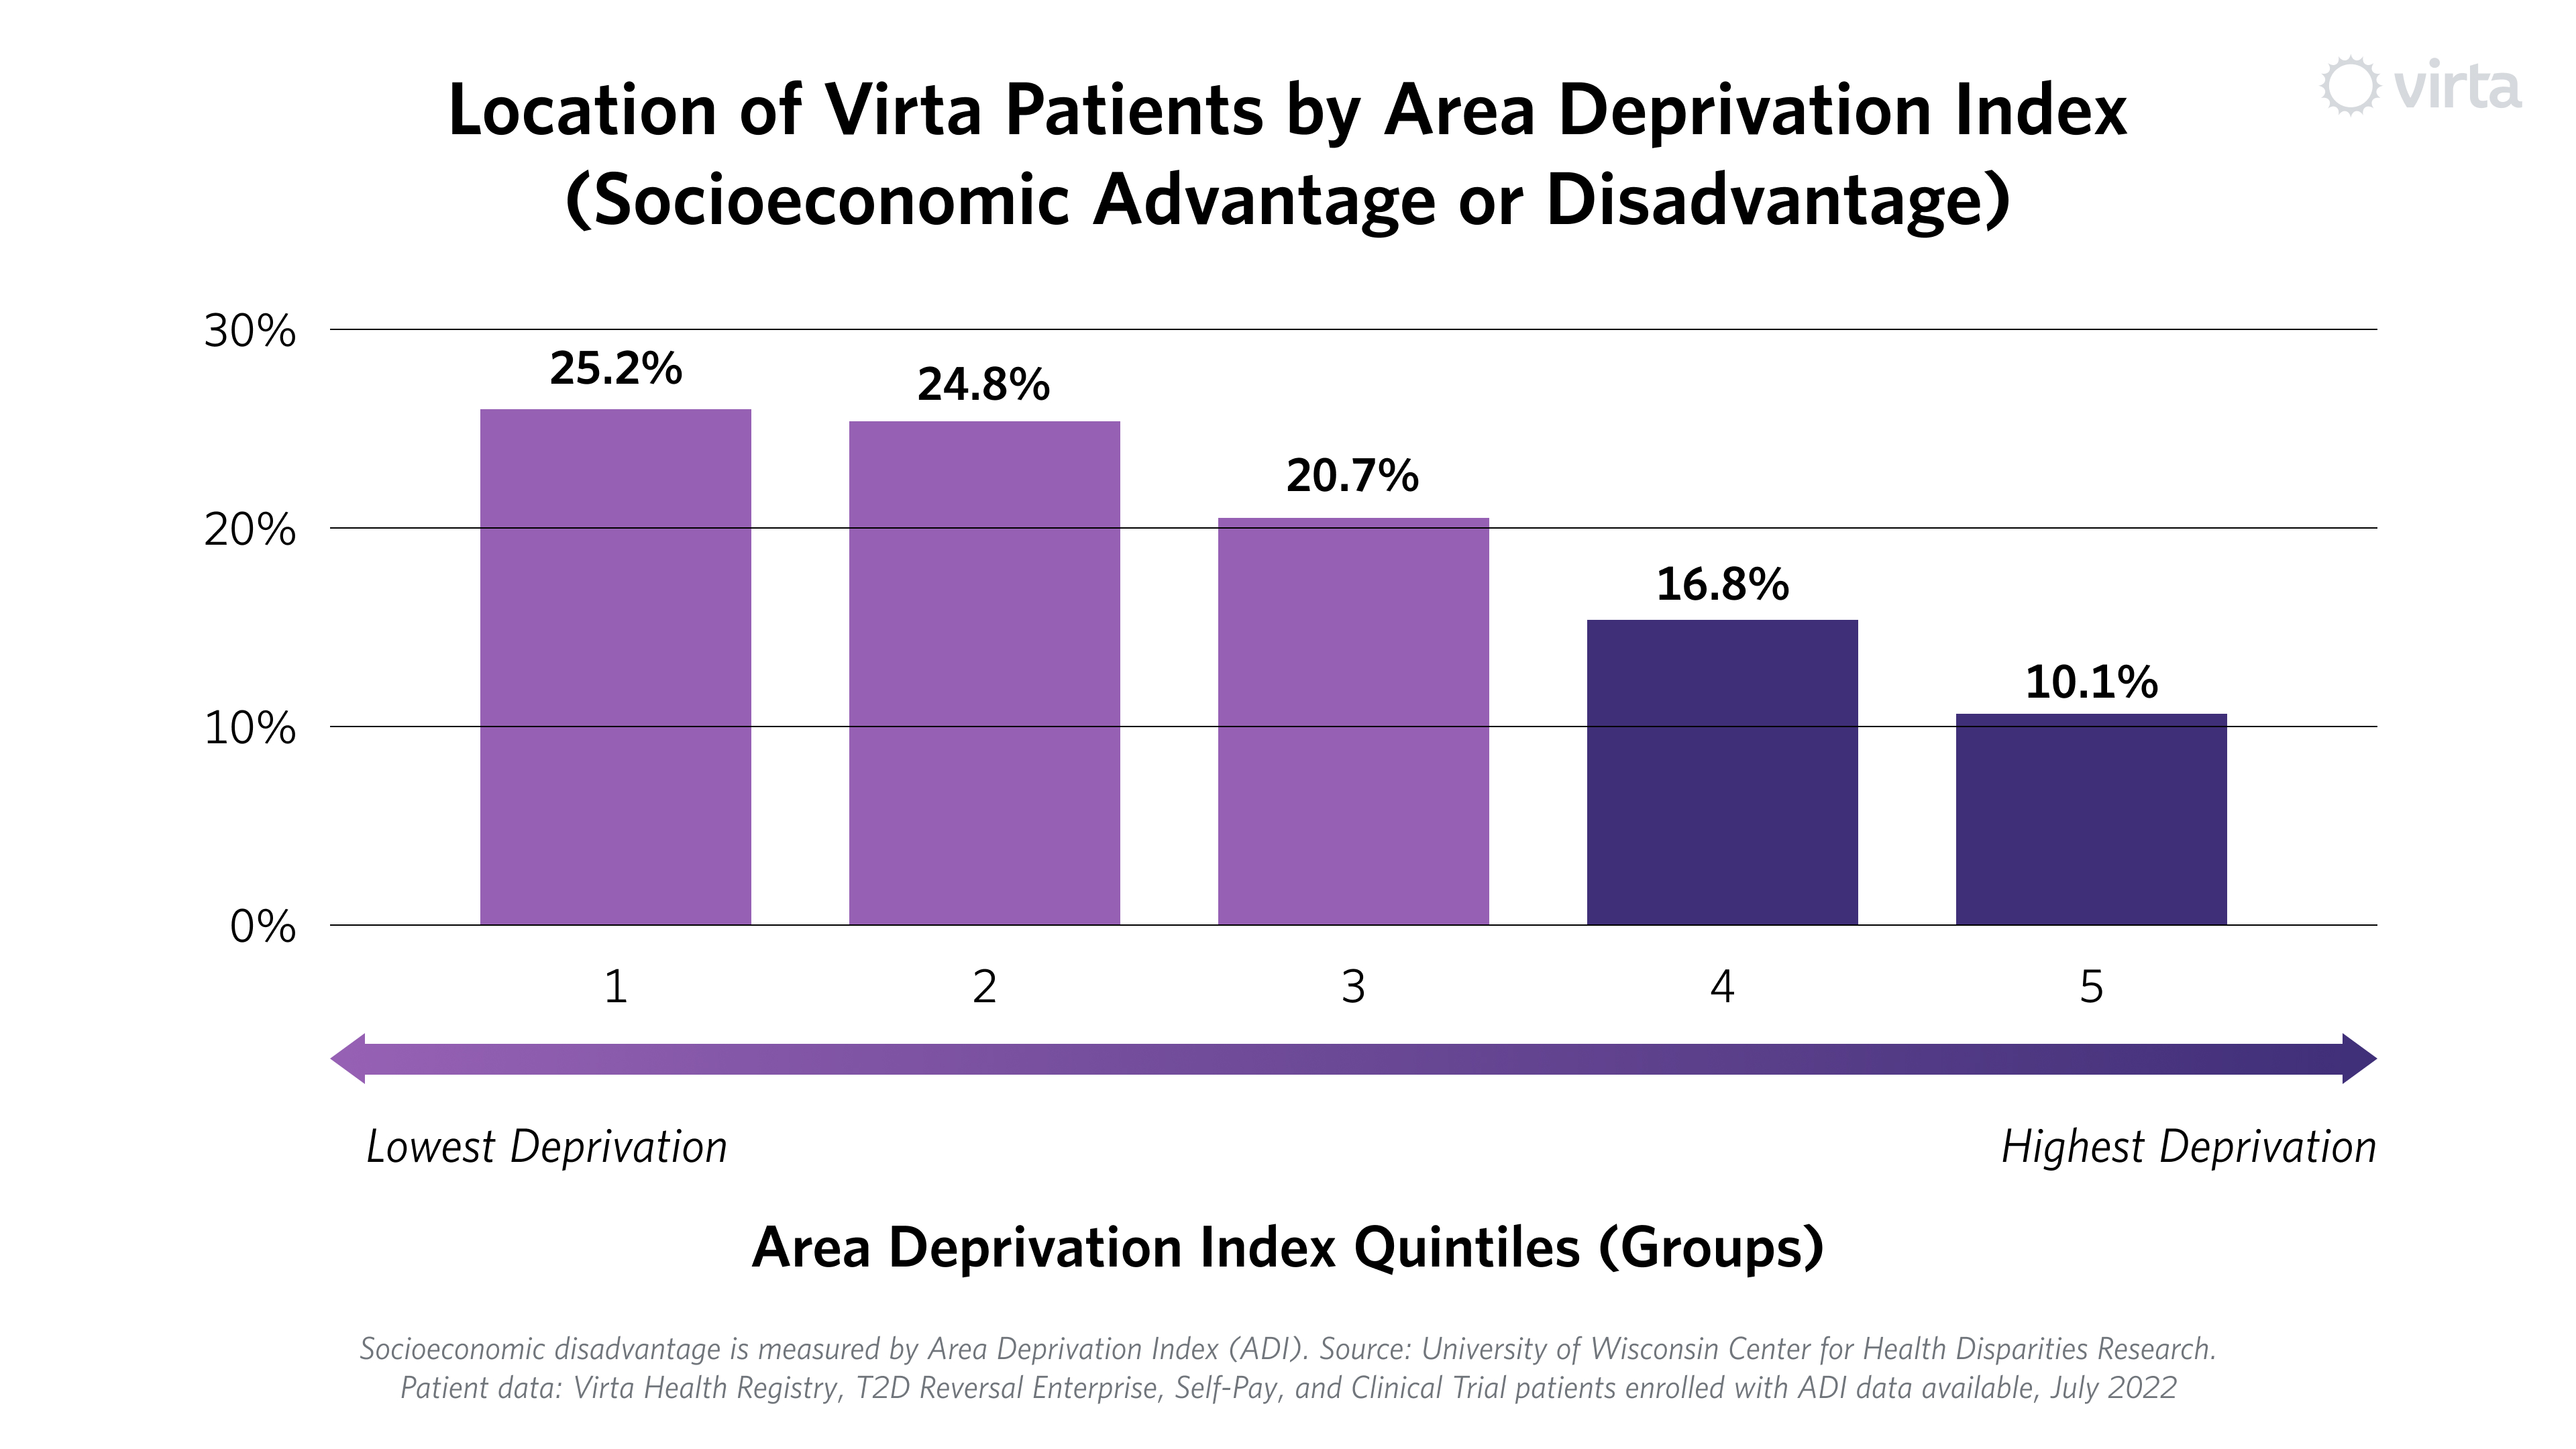
Today we skew toward more advantaged communities, and see an opportunity to increase our population in the more disadvantaged locations. One potential reason for the skew is that we have a small but non-trivial group of patients who self-pay. These individuals may be more likely to reside in advantaged groups. Our self-pay group will become a smaller portion of our overall population as more entities offer Virta as a covered benefit.
In addition, our population could be skewed to the higher quintiles because most of our patients receive Virta through employer-sponsored health insurance, where by definition they are employed and have insurance. Given that seven out of 10 patients with diabetes in the U.S. are covered by public programs, the most significant way we can accelerate a population shift is through partnering with more government-sponsored health plans and programs—a strategic focus for Virta.
The outcomes: Virta’s impact by Area Deprivation Index
Next, we looked at patient outcomes, and discovered that Virta patients achieve life-changing health improvement, irrespective of where they live. All ADI groups experienced at least a one point improvement in HbA1c (blood sugar) on average.² This threshold is important, as each one percentage point drop is associated with reduced risk of complications, including heart attacks, strokes, kidney disease, eye disease and more.

All groups on average achieved results below the American Diabetes Association goal for blood sugar, and some groups even achieved blood sugar (HbA1c) levels below 6.5%—the level used to diagnose type 2 diabetes. Further, these results were achieved while reducing or even eliminating medications. Each group experienced at least a 50% reduction in diabetes prescriptions (excluding metformin).³ This stands in stark contrast to typical diabetes care, where patients often require more medication, especially over longer periods of time.⁴⁻⁵
Much gets written about the power of telemedicine to democratize health care and narrow disparities by enabling high-quality care wherever someone lives. Virta has been a fully-virtual intervention from the beginning. Our results embody telemedicine’s biggest aspirations. Viewing our outcomes through the ADI lens is one way to test this statement, and we are encouraged by what we are seeing.
We suspect one reason we see this level of consistency is that we built individualization into our treatment since day one. We personalize care to each person’s religious and cultural background, food preferences, ability to access and afford healthy food, and medical needs.
This is not to say we’ve fully “cracked the code.” Rather, we are continually asking how we can make these results better, and how we can optimize our approach to better recognize each individual journey. Initiatives already underway—from updating marketing and treatment materials to deepening our cultural competency training to continuing to improve the diversity of our coaching staff—can play a key role. For now though, we are encouraged, even as we recognize that there is important work ahead.
Our health equity series continues in Part III: Outcomes by Race and Ethnicity. In case you missed it, Part I summarizes the disparities that exist in type 2 diabetes care.
Learn more about Virta's health equity work here. Watch a replay of our recent webinar on Closing Health Equity Gaps in diabetes care, which includes a deep dive on Virta's Health Equity Research Study.
This blog is intended for informational purposes only and is not meant to be a substitute for professional medical advice, diagnosis, or treatment. Always seek the advice of your physician or other qualified health provider with any questions you may have regarding a medical condition or any advice relating to your health. View full disclaimer
Are you living with type 2 diabetes, prediabetes, or unwanted weight?

- Patient data: Virta Health Registry, T2D Reversal Enterprise, Self-Pay, and Clinical Trial patients enrolled with ADI data available, July 2022. Groups 4 and 5 represent people living in the top 40% most disadvantaged areas of the United States.
- Population includes patients enrolled in Virta’s type 2 diabetes reversal program as of July 2022 who are retained for more than 180 days.
- Data displays percent change in the number of diabetes medications other than metformin 180 days into treatment compared to enrollment
- Hallberg SJ, McKenzie AL, Williams PT, et al. Effectiveness and Safety of a Novel Care Model for the Management of Type 2 Diabetes at 1 Year: An Open-Label, Non-Randomized, Controlled Study. Diabetes Therapy. 2018; 9:583–612.
- The Look Ahead Research Group. Long-term Effects of a Lifestyle Intervention on Weight and Cardiovascular Risk Factors in Individuals with Type 2 Diabetes Mellitus - Four-year results of the Look AHEAD Trial. Arch Intern Med. 2010; 170: 1566-1575.


.jpg)