
Hope for Health Equity (Part III): Virta Patient Outcomes by Race and Ethnicity


Key Takeaways
- Virta Health collected more complete race and ethnicity data aligned with federal standards to better measure outcomes across its commercially insured population.
- All racial and ethnic groups saw HbA1c fall by at least 1.1% to 1.4%, and every group reached or beat the ADA target of below 7.0%.
- All groups achieved these blood sugar improvements while reducing diabetes medication use by 52% to 59%, excluding metformin.
- Virta Health combines better blood sugar control with lower medication needs across diverse patient groups, making it a strong option for organizations focused on equitable diabetes care.
In Part I of this series, we outlined how type 2 diabetes is inherently a health equity issue: patients with socioeconomic challenges and people from many racial and ethnic minority groups are not only more likely to have type 2 diabetes, they also experience severe complications and poor outcomes at significantly higher rates. In Part II, we looked at how Virta is able to deliver consistent, world-class health outcomes to patients living in areas across a wide range of socioeconomic conditions. In Part III, we now look at Virta’s outcomes by race and ethnicity.
Across healthcare, examining data by race and ethnicity—the foundation of understanding and improving disparities—presents significant hurdles. Public programs in particular suffer from “a critical lack of complete, standardized, self-identified race and ethnicity data” according to a recent NCQA report. Further, people are often unwilling to share personal information for fear of discrimination, or because they don’t identify with the options provided.
Health equity experts we’ve spoken with echo these challenges, underscoring how much work is to be done throughout the healthcare system. Virta addressed these challenges by adopting race and ethnicity data collection categories that better align to federal standards. We also undertook a rigorous data collection effort with our commercial population. This gave us insight into patients across our business, which primarily comes from more than 300 self-insured employers and commercial health plans that are our partners.
It is unsurprising, then, that the race and ethnicity composition closely mirrors that of the broader commercially-insured population nationally (with some notable exceptions, where today we under-index among non-Hispanic Asian and Hispanic or Latino populations).¹
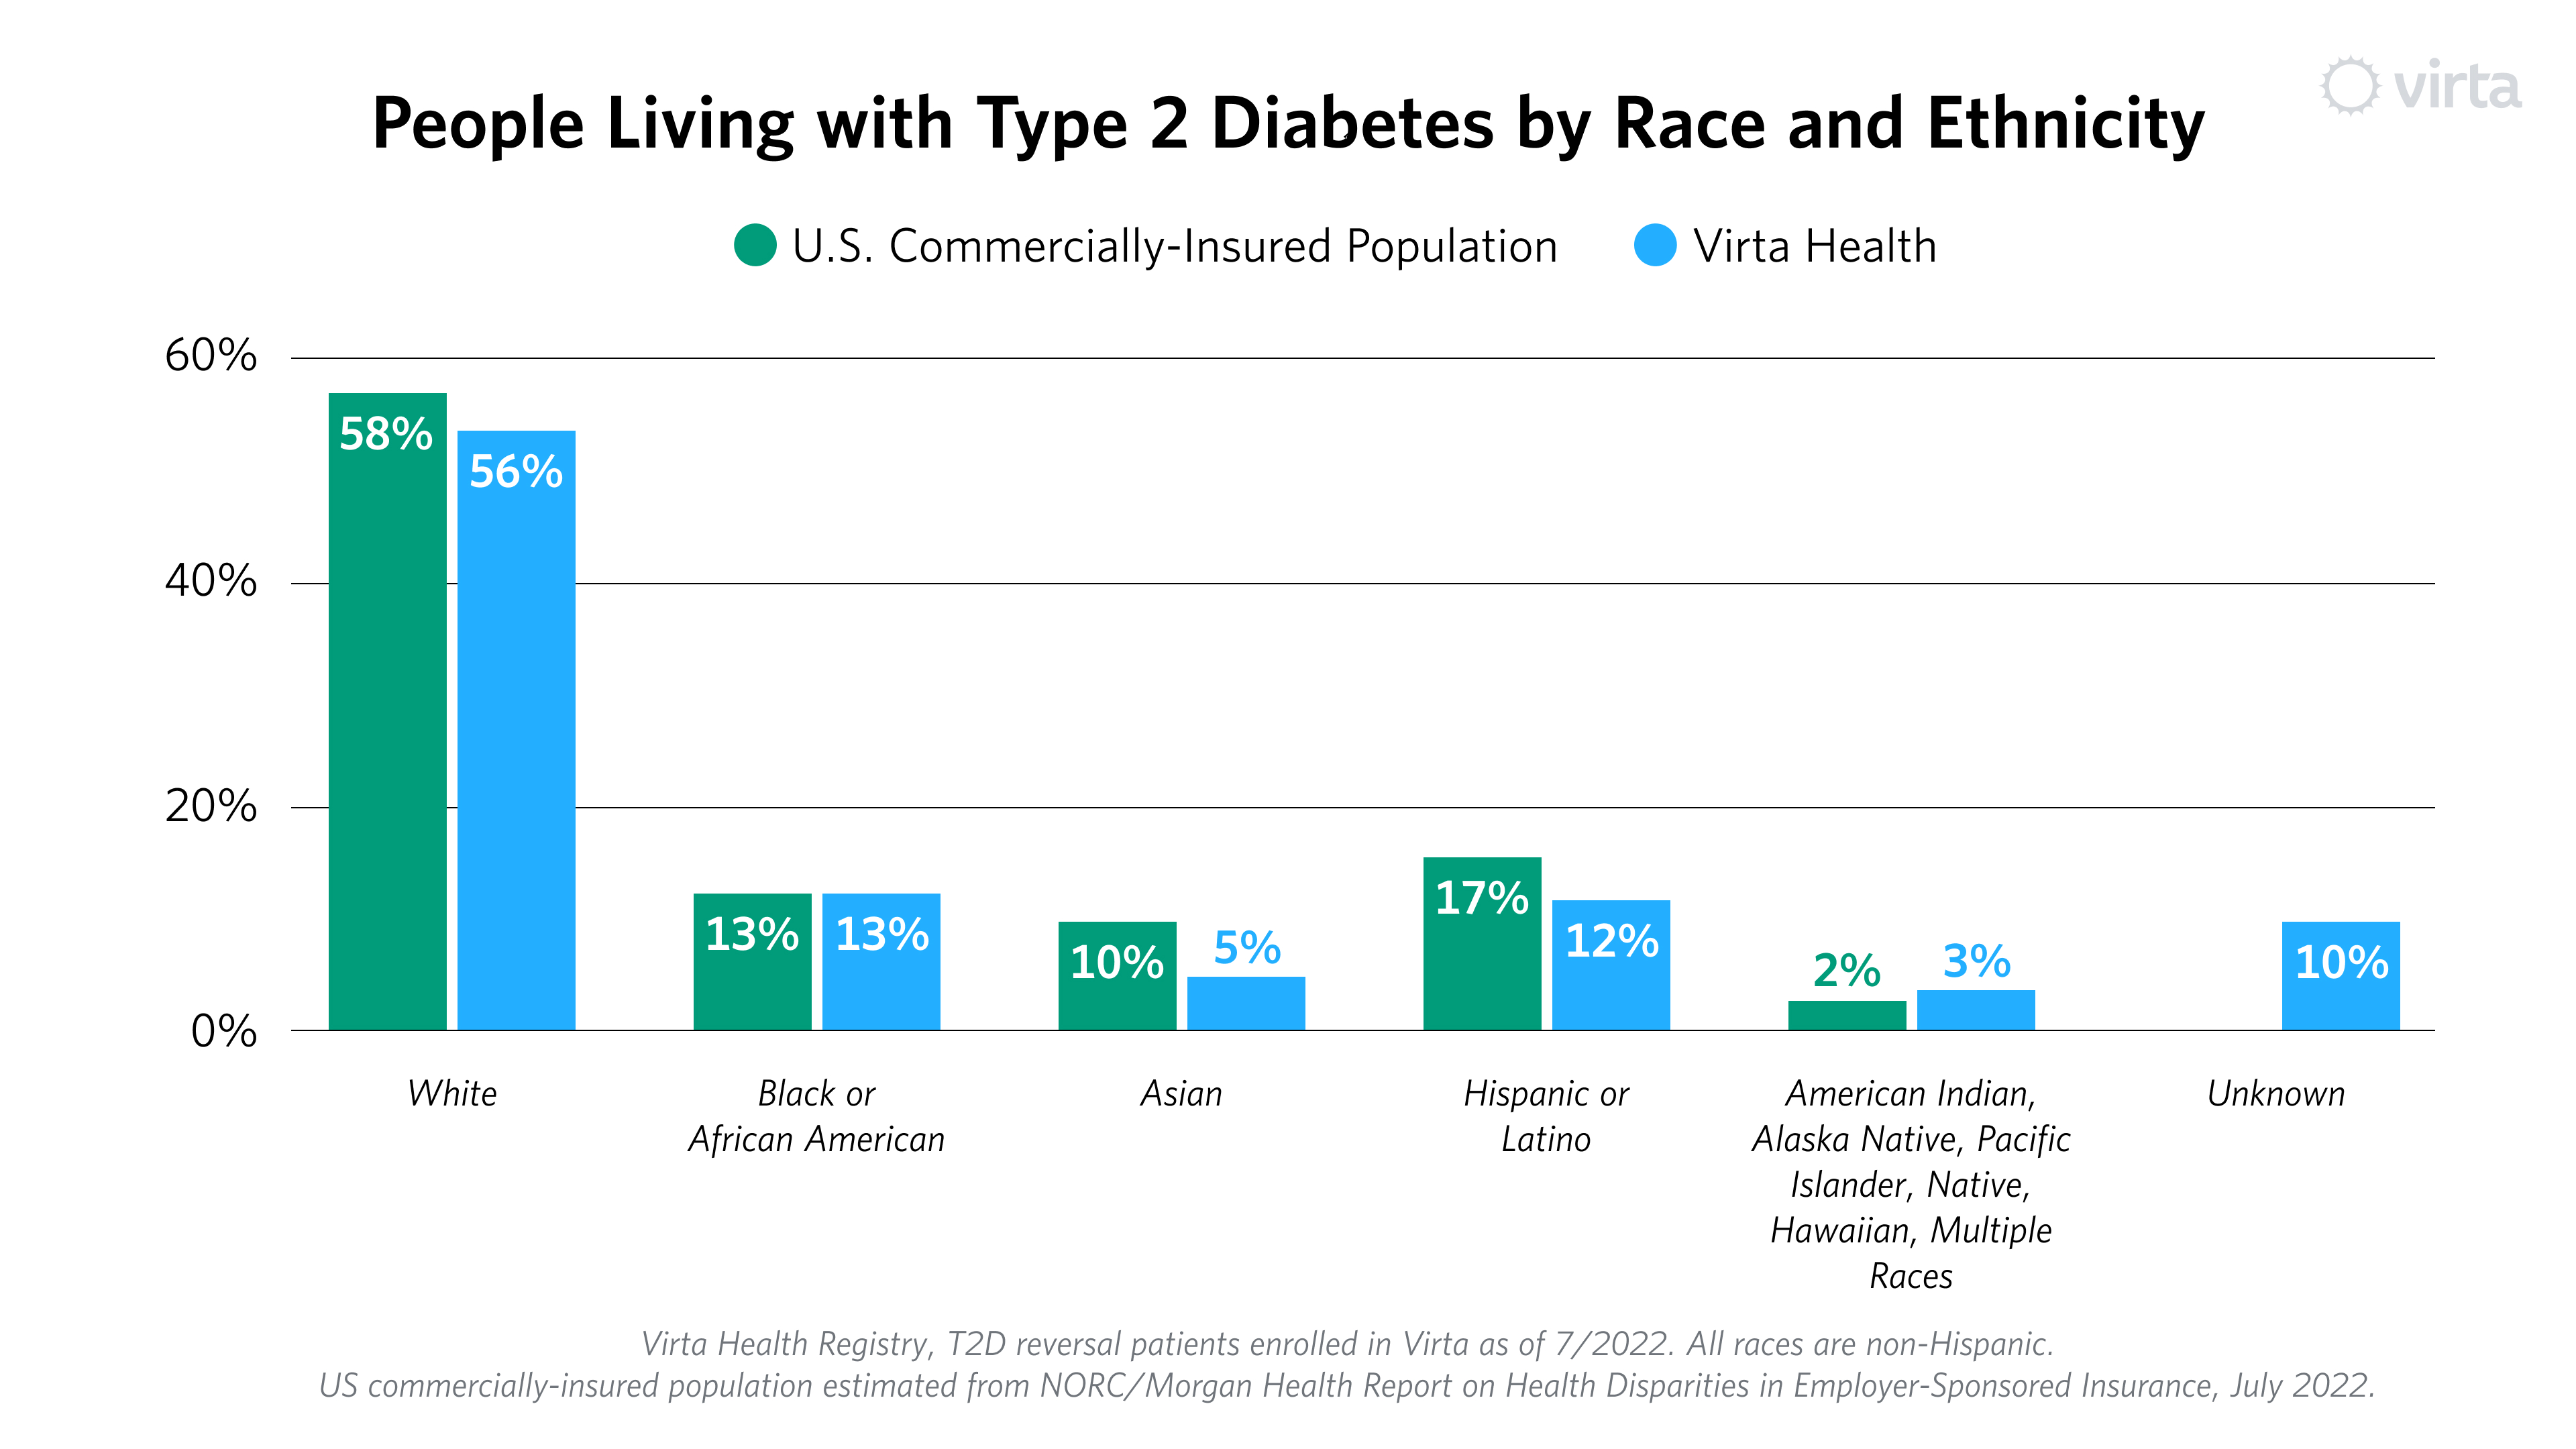
In raw numbers, one third of our patients come from racial and ethnic minority groups. Many of these groups experience higher than average prevalence of type 2 diabetes, and we see an opportunity to increase enrollment among the communities that are most affected. Some of this will happen organically, as Virta begins to work with more government-sponsored plans and programs that provide Virta as a covered benefit. We also see the opportunity to implement additional programs that expand our reach in these communities.
Virta Patient Outcome by Race and Ethnicity
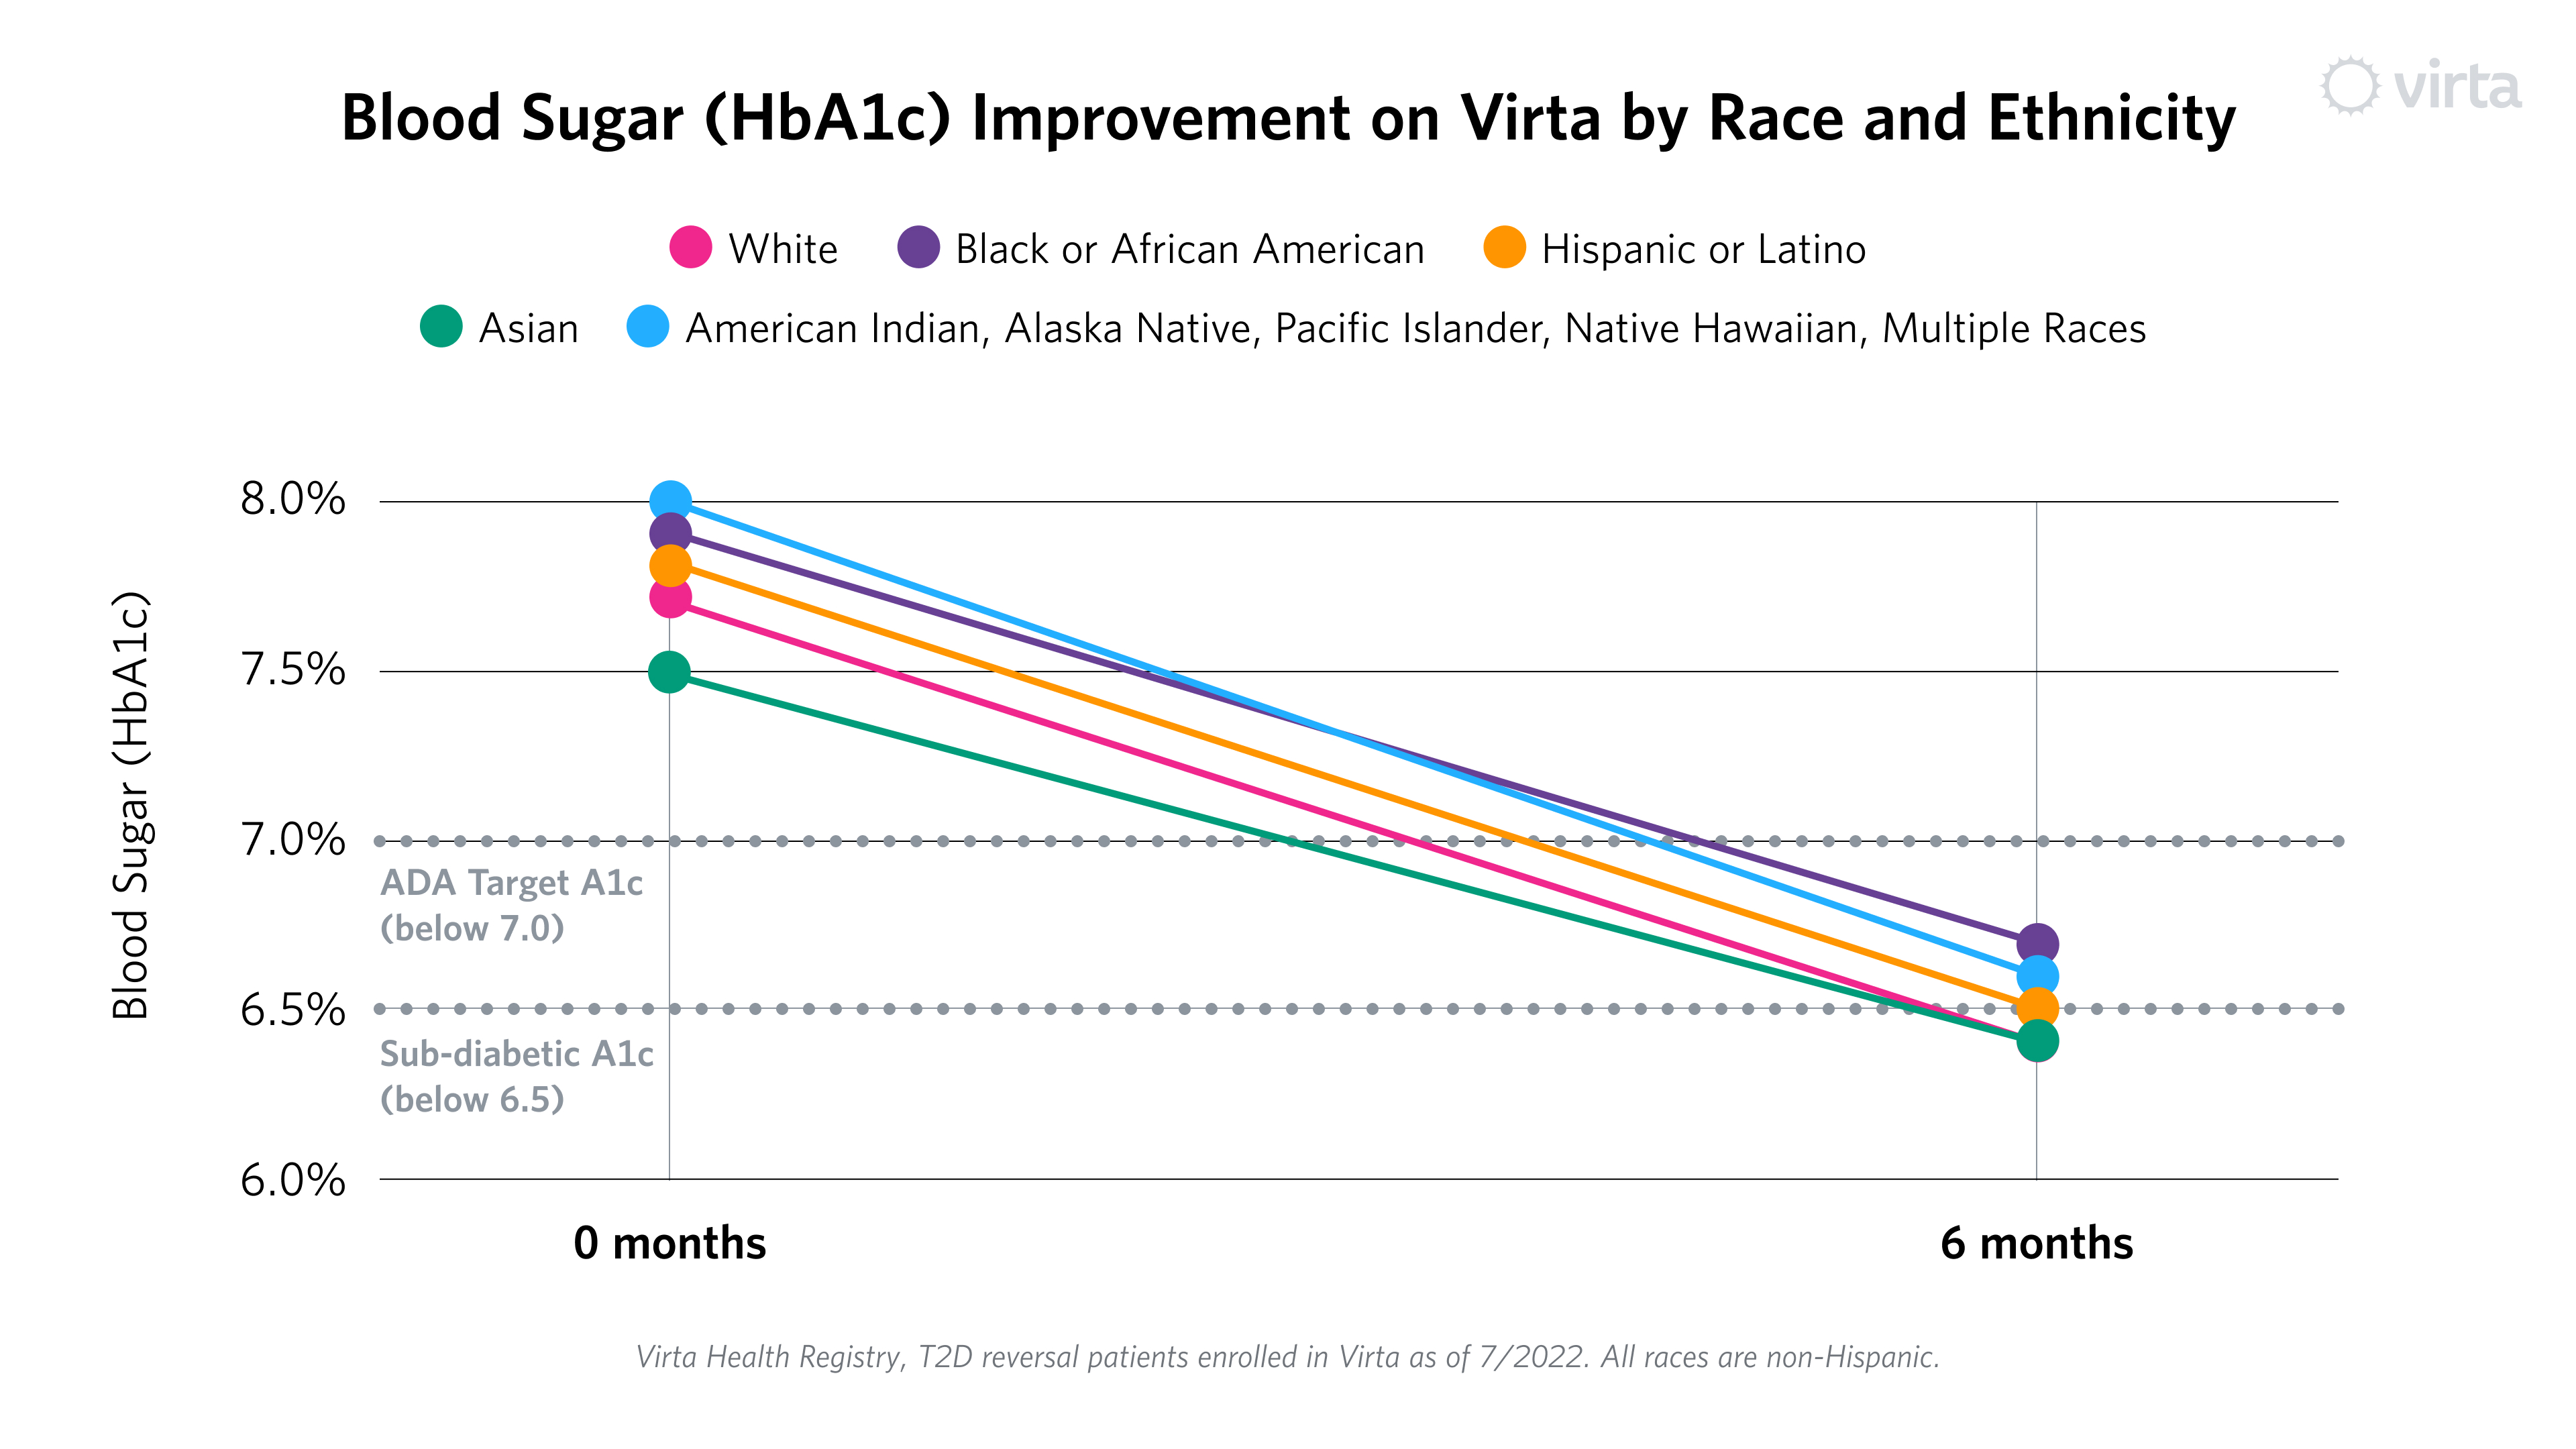
With that context, let’s look at the results. Much like the ADI groups highlighted in Part II, all racial and ethnic groups had at least a one point drop in HbA1c (blood sugar), ranging from 1.1% to 1.4%.² This is clinically important, as every percentage point decrease in HbA1c is associated with a lower risk of complications (heart attack, stroke, kidney disease, eye disease and more). Notably, all groups met or fell below the American Diabetes Association treatment target of blood sugar below 7.0%. Some groups even reached an average HbA1c below 6.5%, the level for diagnosis for type 2 diabetes.
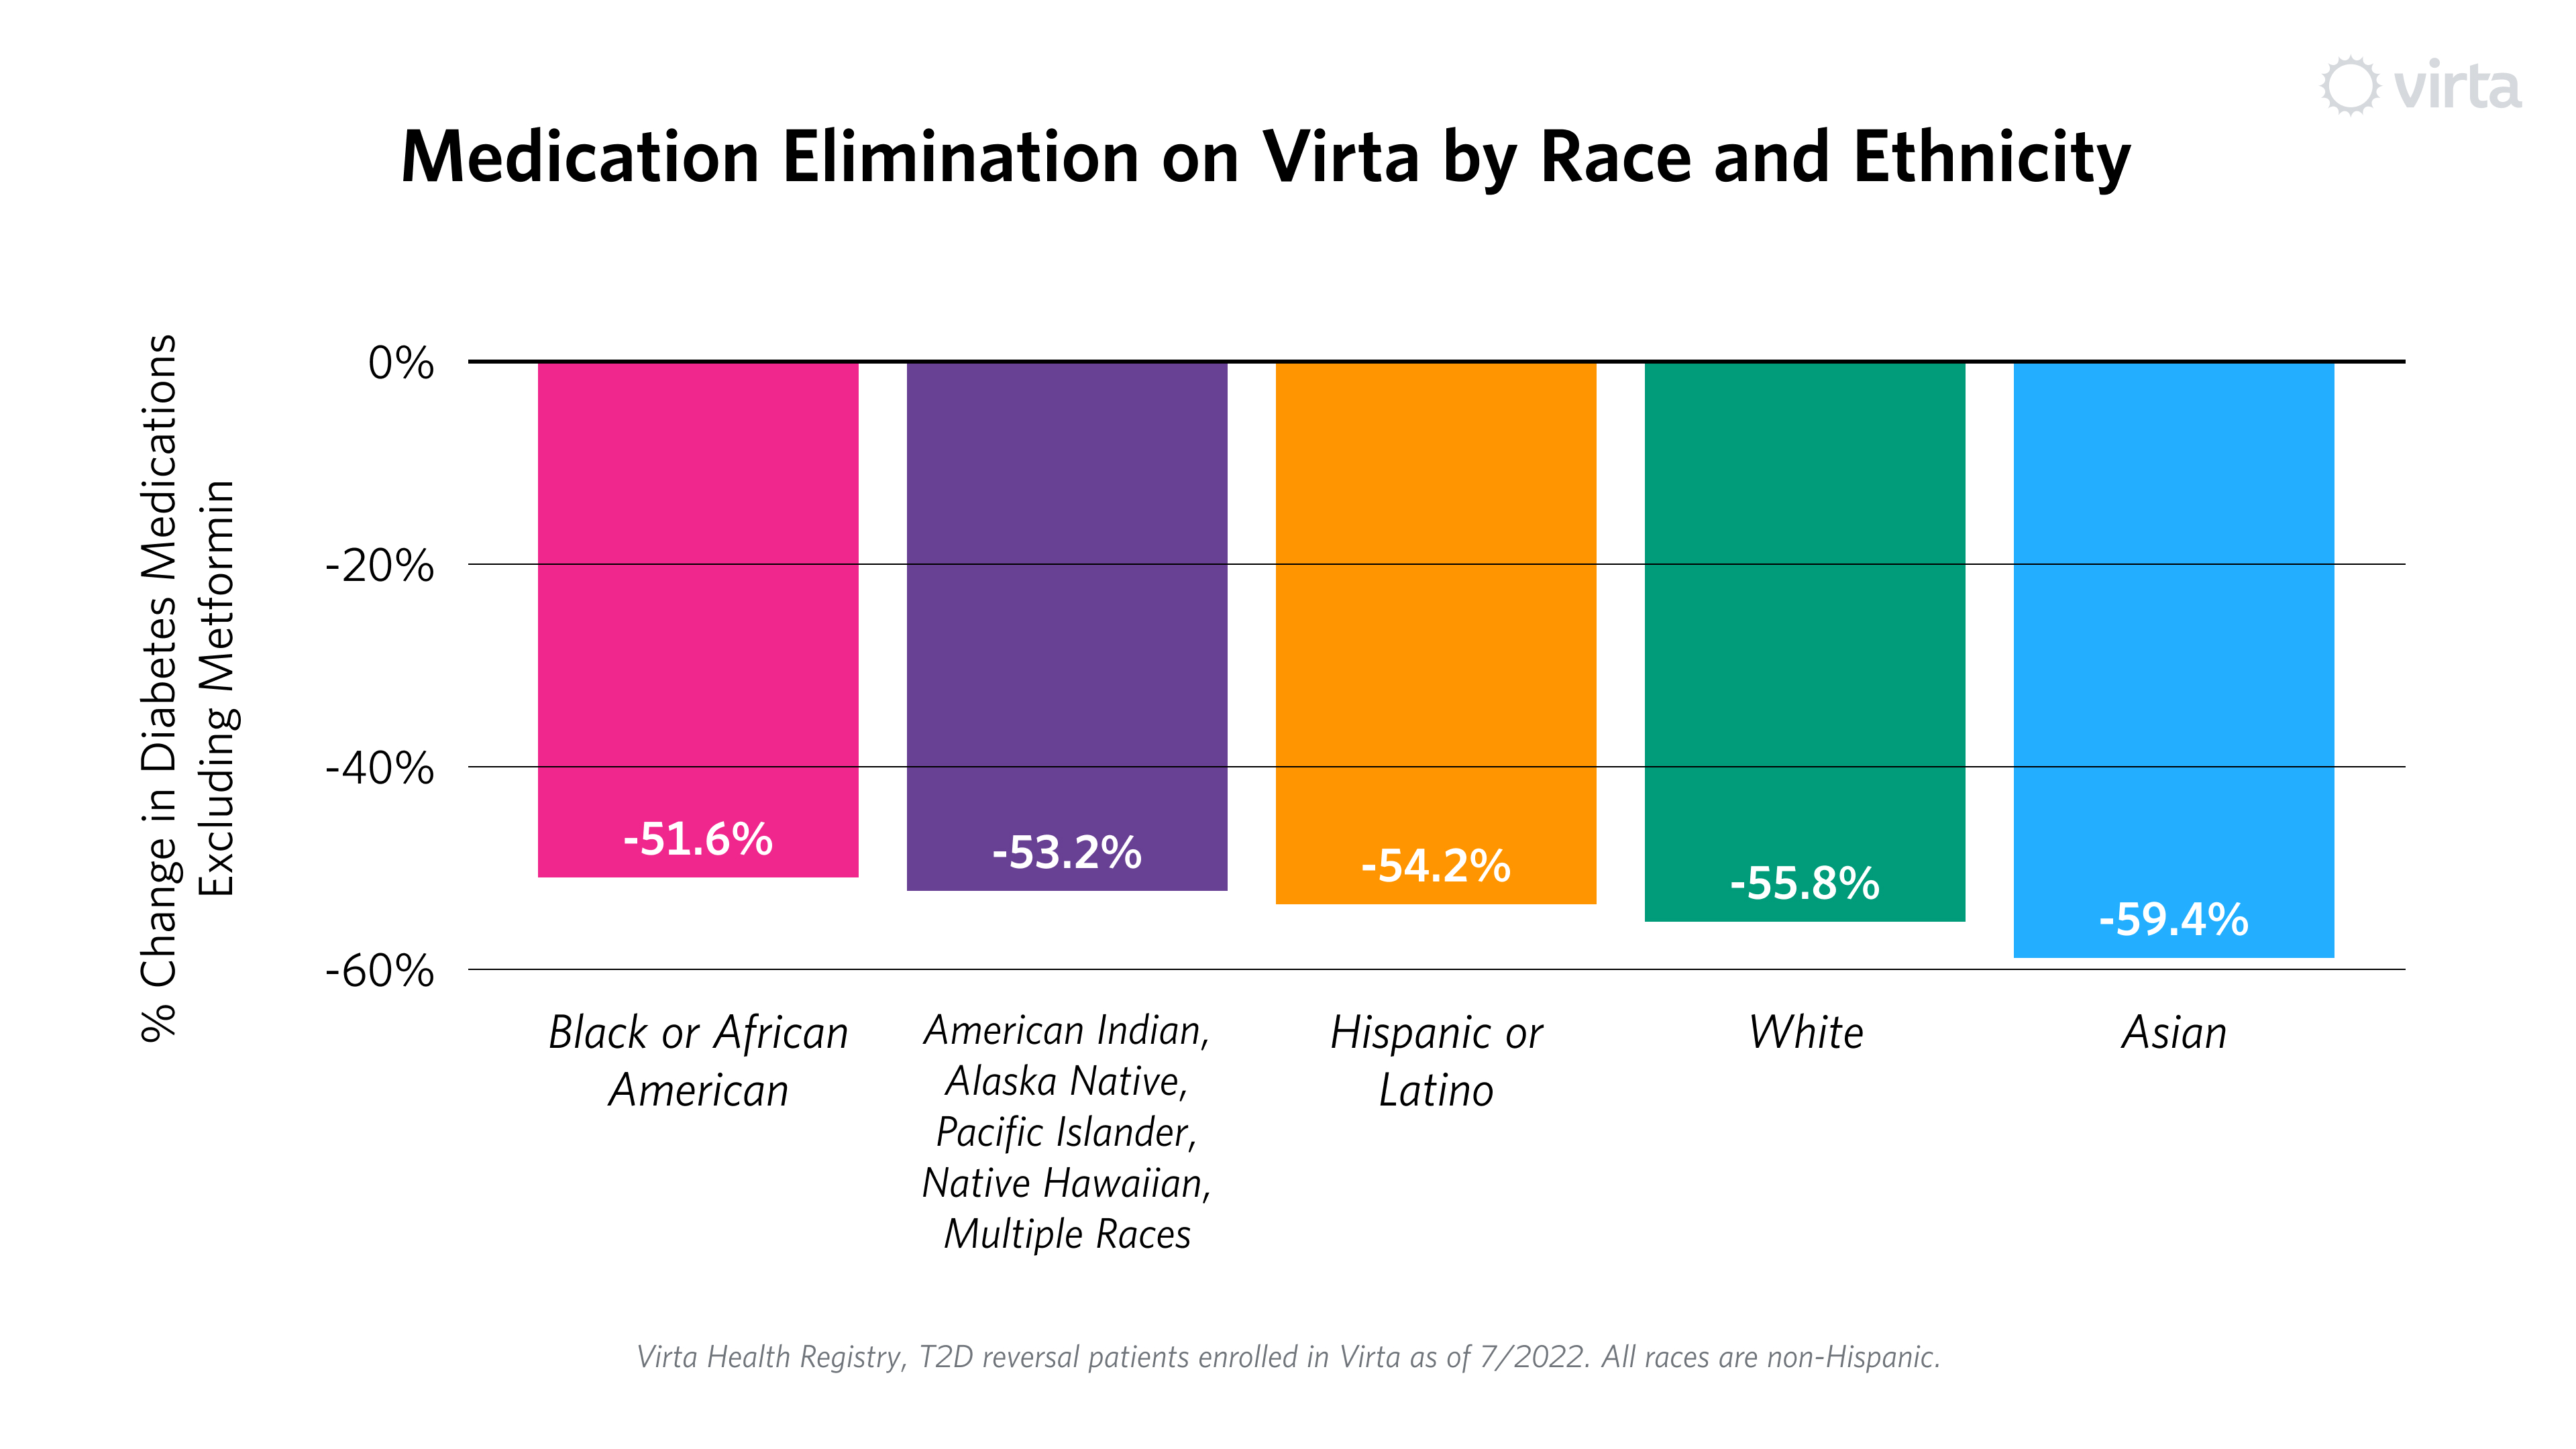
Critically, once again these improvements happened with significantly fewer medications, ranging from 52% to 59% reduction in overall use of diabetes prescriptions, excluding metformin.² This is counter to what typically happens within usual diabetes care, where there has been no improvement in population-level outcomes over a 10-year period, and emphasis is placed on medication adherence, not reduction in need.
In summary, Virta’s outcomes materially improve the health of our patients, through better blood sugar levels and less need for medication, irrespective of self-reported race and ethnicity. Mere “management” by chasing A1c with more and more medication fails to reverse the devastating trends in prevalence and cost that have been marching upward for decades.
And still, there is much more to be done. Although the results are clinically significant across all groups, differences remain. For example, non-Hispanic White people achieve sub-diabetic blood sugar at slightly higher rates than other groups.
We don’t yet know exactly why this is, and much of the next phase of our work is asking why we see the results we do, so we can better inform our clinical roadmap to limit gaps and further increase effectiveness for all patients. Even so, there are things we are doing now that can help. For example, we have already increased the diversity of our coaches, and can continue to do so. Similarly, we can expand our cultural competency training initiatives, provide more culturally relevant content from marketing to enrollment to treatment, and more.
While we acknowledge the work ahead, we also celebrate the results we see within our diverse patient population. We see promise to help people with diabetes achieve profound health transformation, no matter where they live, their socioeconomic situation, or their race or ethnicity. More than ever, we are dedicated to making this a reality, and excited to build on this data to develop a roadmap to guide our future and the care we provide. And, we look forward to continuing to share what we learn along the way.
This concludes our three-part health equity series. In case you missed it, Part I summarized the disparities that exist in type 2 diabetes care. Part II examined Virta patient outcomes by socioeconomic status.
Learn more about Virta's health equity work here. Watch a replay of our recent webinar on Closing Health Equity Gaps in diabetes care, which includes a deep dive on Virta's Health Equity Research Study.
This blog is intended for informational purposes only and is not meant to be a substitute for professional medical advice, diagnosis, or treatment. Always seek the advice of your physician or other qualified health provider with any questions you may have regarding a medical condition or any advice relating to your health. View full disclaimer
Are you living with type 2 diabetes, prediabetes, or unwanted weight?

- Population is from Virta’s Enterprise deployments and Self-Pay and Clinical Trial patients who were enrolled in Virta’s type 2 diabetes reversal program as of July 2022. All races reflected on the graph are non-Hispanic. Proportion of US commercially-insured population with T2D identifying as each race and ethnicity was estimated from data contained in the NORC/Morgan Health Report on Health Disparities in Employer-Sponsored Insurance among working age individuals (25-64 years of age) with private insurance, July 2022.
- Population includes patients enrolled in Virta’s type 2 diabetes reversal program who were treated for more than 180 days as of July 2022.
- Data displays percent change in the number of diabetes medications other than metformin prescribed to the group 180 days into treatment compared to enrollment.


.jpg)