

Data
Medication Elimination

Hallberg SJ, McKenzie AL, Williams P, et al. Effectiveness and Safety of a Novel Care Model for the Management of Type 2 Diabetes at One Year: An Open Label, Non-Randomized, Controlled Study. Diabetes Ther. 2018. DOI: 10.1007/s13300-018-0373-9
A1c Reduction

Hallberg SJ, McKenzie AL, Williams P, et al. Effectiveness and Safety of a Novel Care Model for the Management of Type 2 Diabetes at One Year: An Open Label, Non-Randomized, Controlled Study. Diabetes Ther. 2018. DOI: 10.1007/s13300-018-0373-9
Weight Reduction

Hallberg SJ, McKenzie AL, Williams P, et al. Effectiveness and Safety of a Novel Care Model for the Management of Type 2 Diabetes at One Year: An Open Label, Non-Randomized, Controlled Study. Diabetes Ther. 2018. DOI: 10.1007/s13300-018-0373-9
Retention

Virta Health Registry for Remote Care of Chronic Conditions. Health and economic outcomes as of March 2019
Polonsky WH, Henry RR. Poor medication adherence in type 2 diabetes: recognizing the scope of the problem and its key contributors. Patient Prefer Adherence. 2016;10:1299–1307. Published 2016 Jul 22. doi:10.2147/PPA.S106821
Martin CK, Talamini L, Johnson A, Hymel AM, Khavjou O. Weight loss and retention in a commercial weight-loss program and the effect of corporate partnership. Int J Obes (Lond). 2010;34(4):742–750. doi:10.1038/ijo.2009.276
Rx Reduction

Athinarayanan SJ, Adams RN, Hallberg SJ, et al. Long-Term Effects of a Novel Continuous Remote Care Intervention Including Nutritional Ketosis for the Management of Type 2 Diabetes: A 2-year Non-randomized Clinical Trial. Frontiers in Endocrinology. 2019; 10:348. DOI: 10.3389/fendo.2019.00348
Type 2 Diabetes
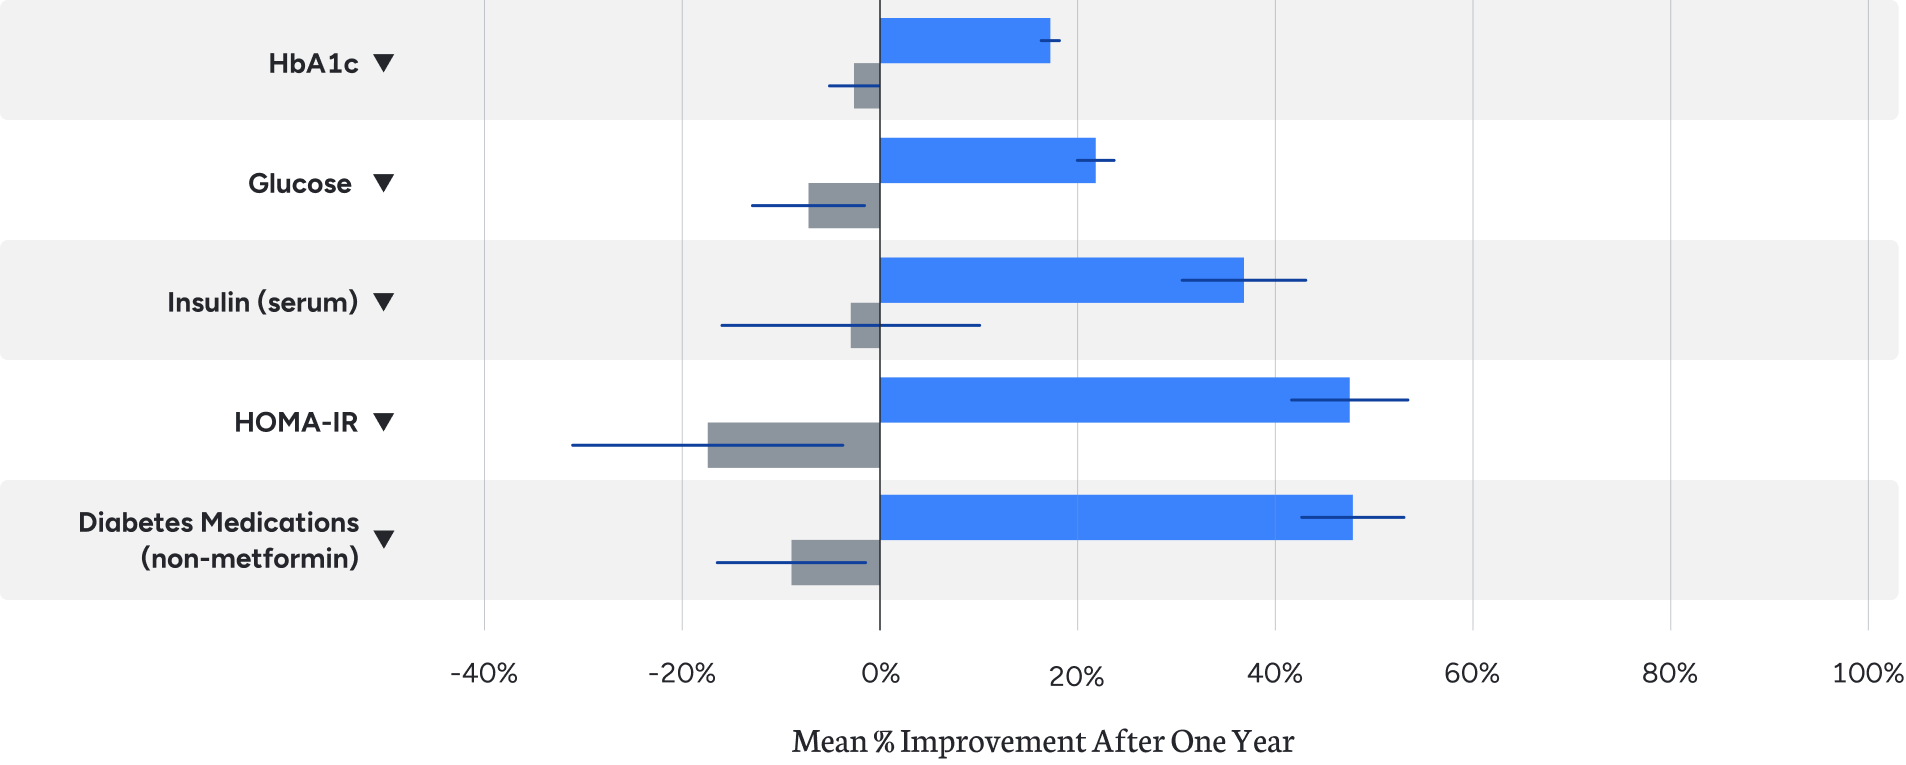
Hallberg SJ et al. Diabetes Therapy. 2018;9(2):583-612 and Bhanpuri NH et al. Cardiovasc Diabetol. 2018; 17:56.
Obesity

Hallberg SJ et al. Diabetes Therapy. 2018;9(2):583-612 and Bhanpuri NH et al. Cardiovasc Diabetol. 2018; 17:56.
Atherogenic Dyslipidemia
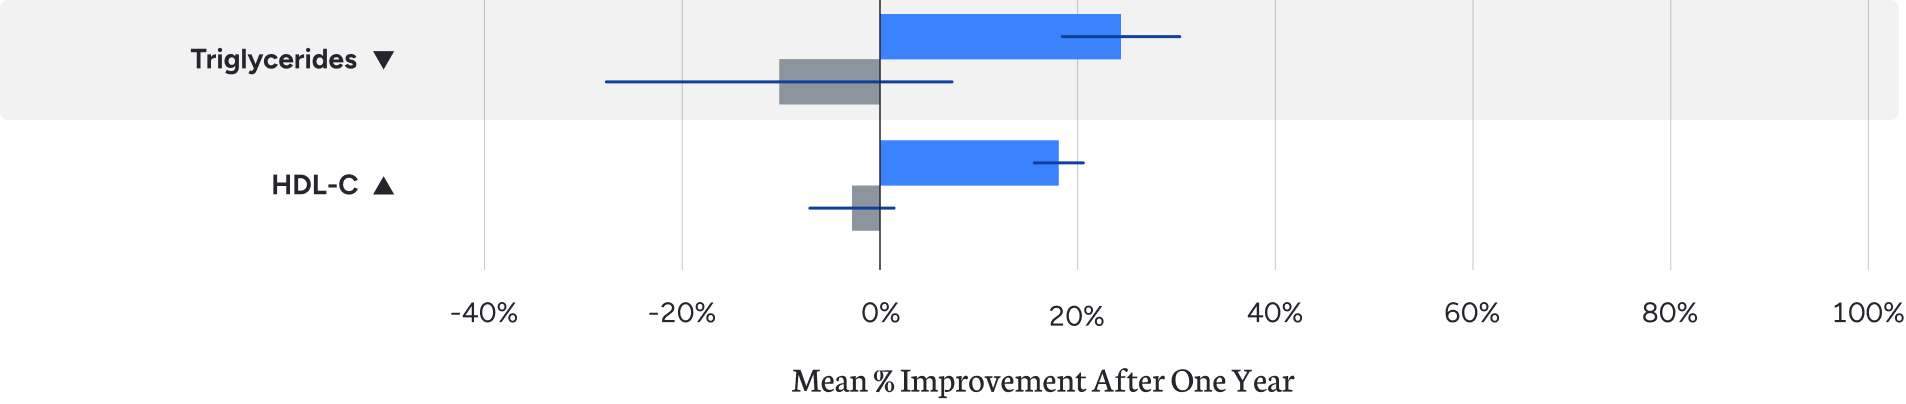
Hallberg SJ et al. Diabetes Therapy. 2018;9(2):583-612 and Bhanpuri NH et al. Cardiovasc Diabetol. 2018; 17:56.
Hypertension
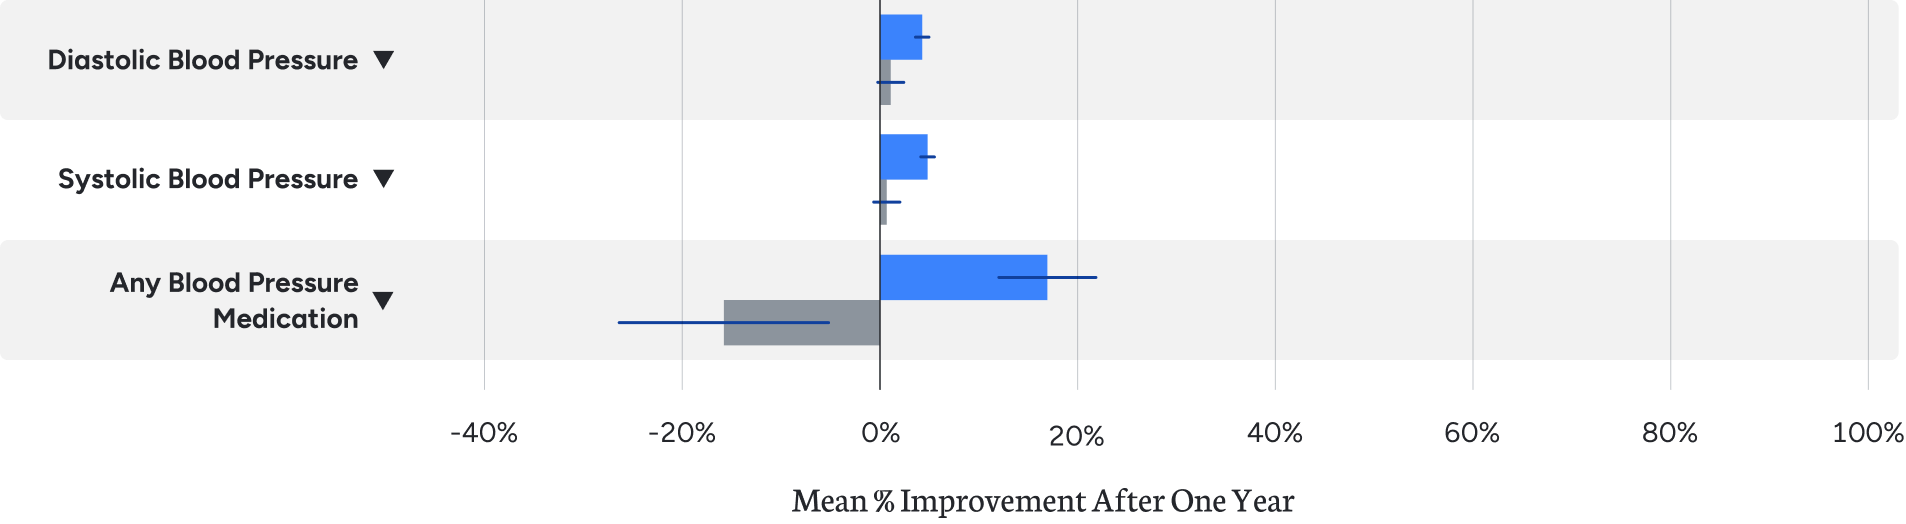
Hallberg SJ et al. Diabetes Therapy. 2018;9(2):583-612 and Bhanpuri NH et al. Cardiovasc Diabetol. 2018; 17:56.
Inflammation
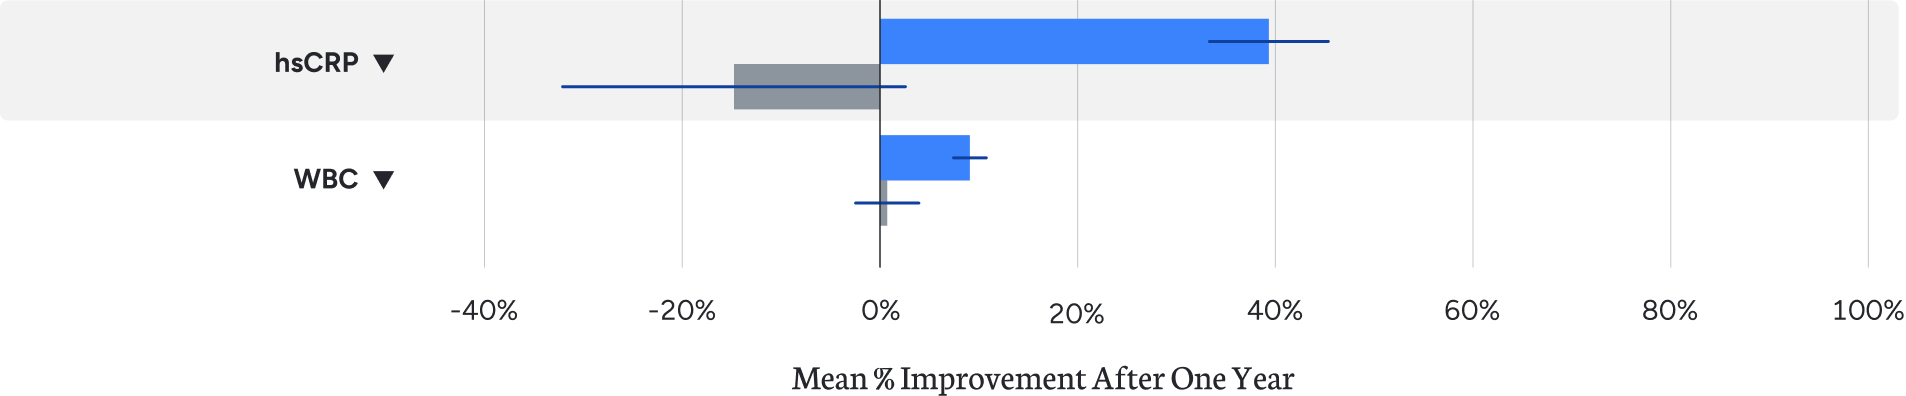
Hallberg SJ et al. Diabetes Therapy. 2018;9(2):583-612 and Bhanpuri NH et al. Cardiovasc Diabetol. 2018; 17:56.
Safety
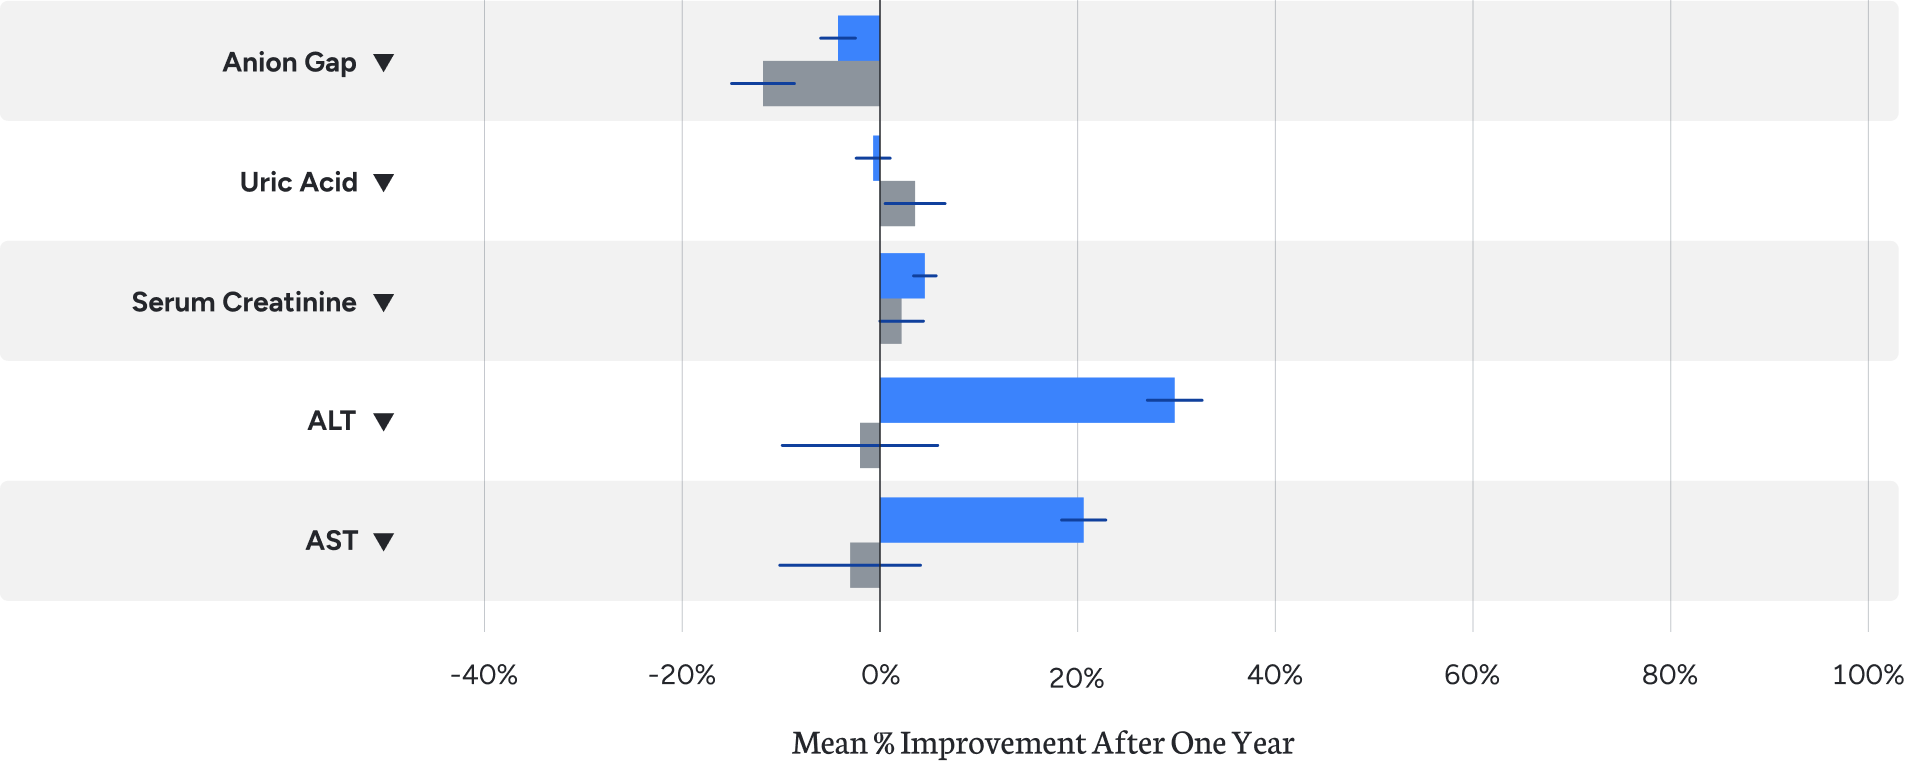
Hallberg SJ et al. Diabetes Therapy. 2018;9(2):583-612 and Bhanpuri NH et al. Cardiovasc Diabetol. 2018; 17:56.
Cardiovascular Risk Markers
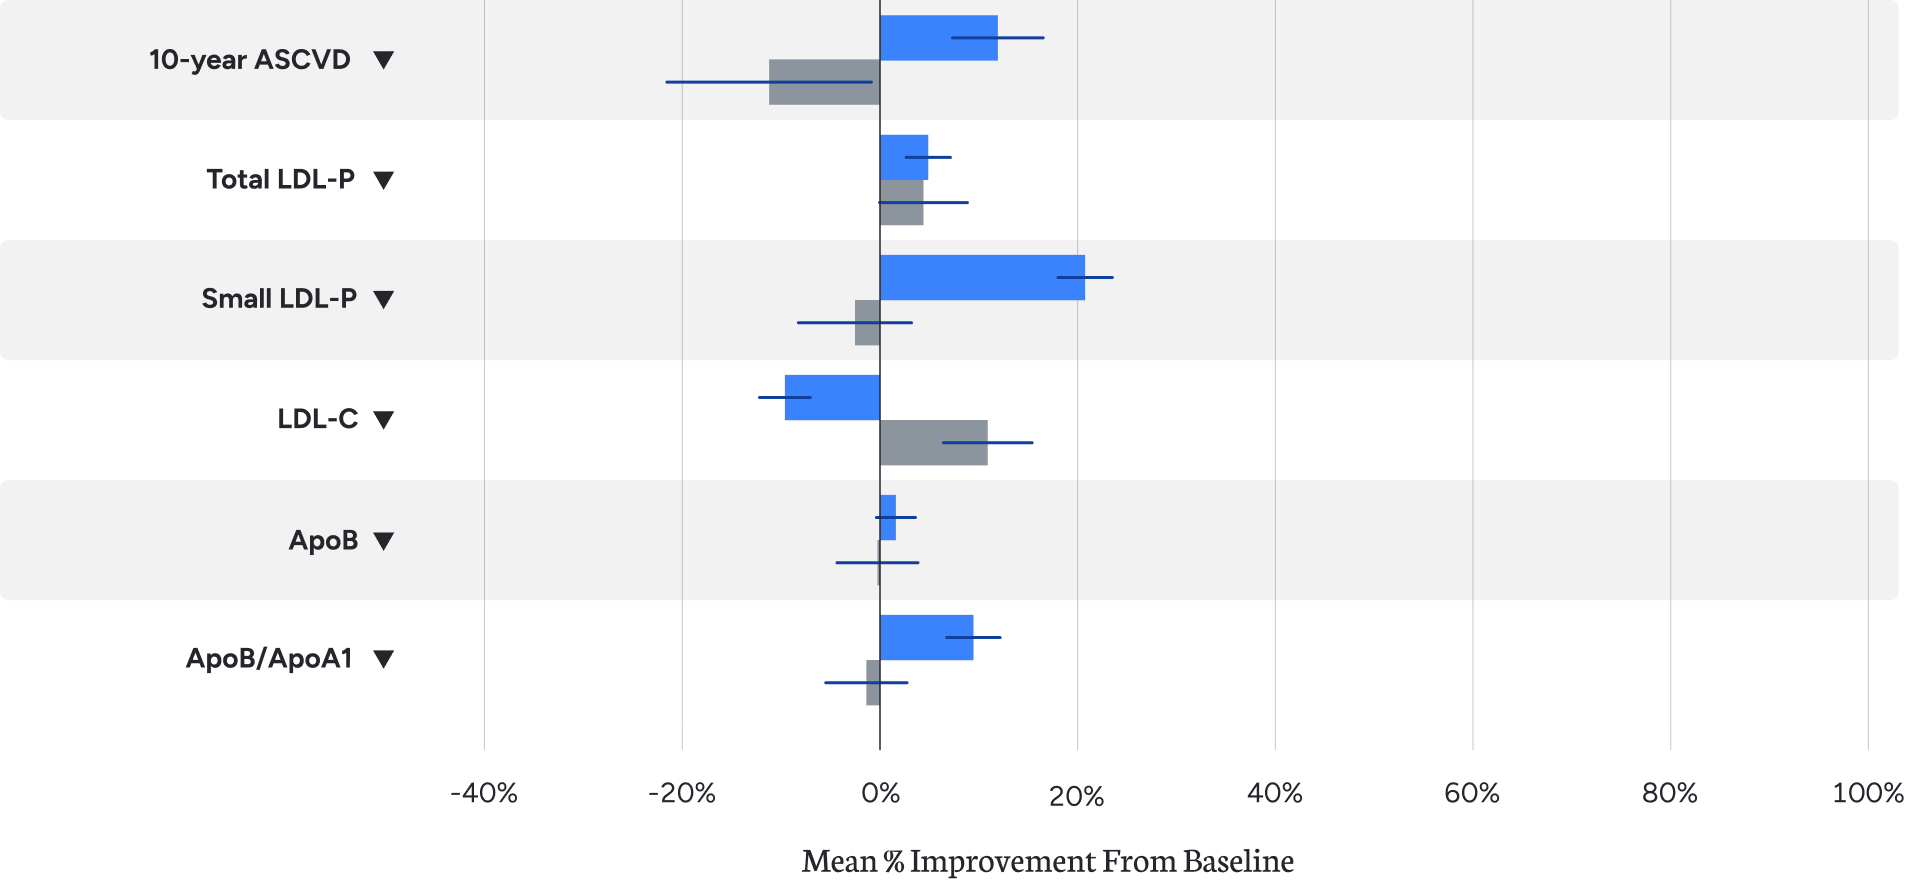
Hallberg SJ et al. Diabetes Therapy. 2018;9(2):583-612 and Bhanpuri NH et al. Cardiovasc Diabetol. 2018; 17:56.